
Operational Business Intelligence
Turn field data into live dashboards — track KPIs, spot trends, give management the numbers.
Intuitive Dashboard
Create custom layouts with a simple no-code, drag-and-drop interface.
Configure views and resize elements rapidly without needing any technical expertise.
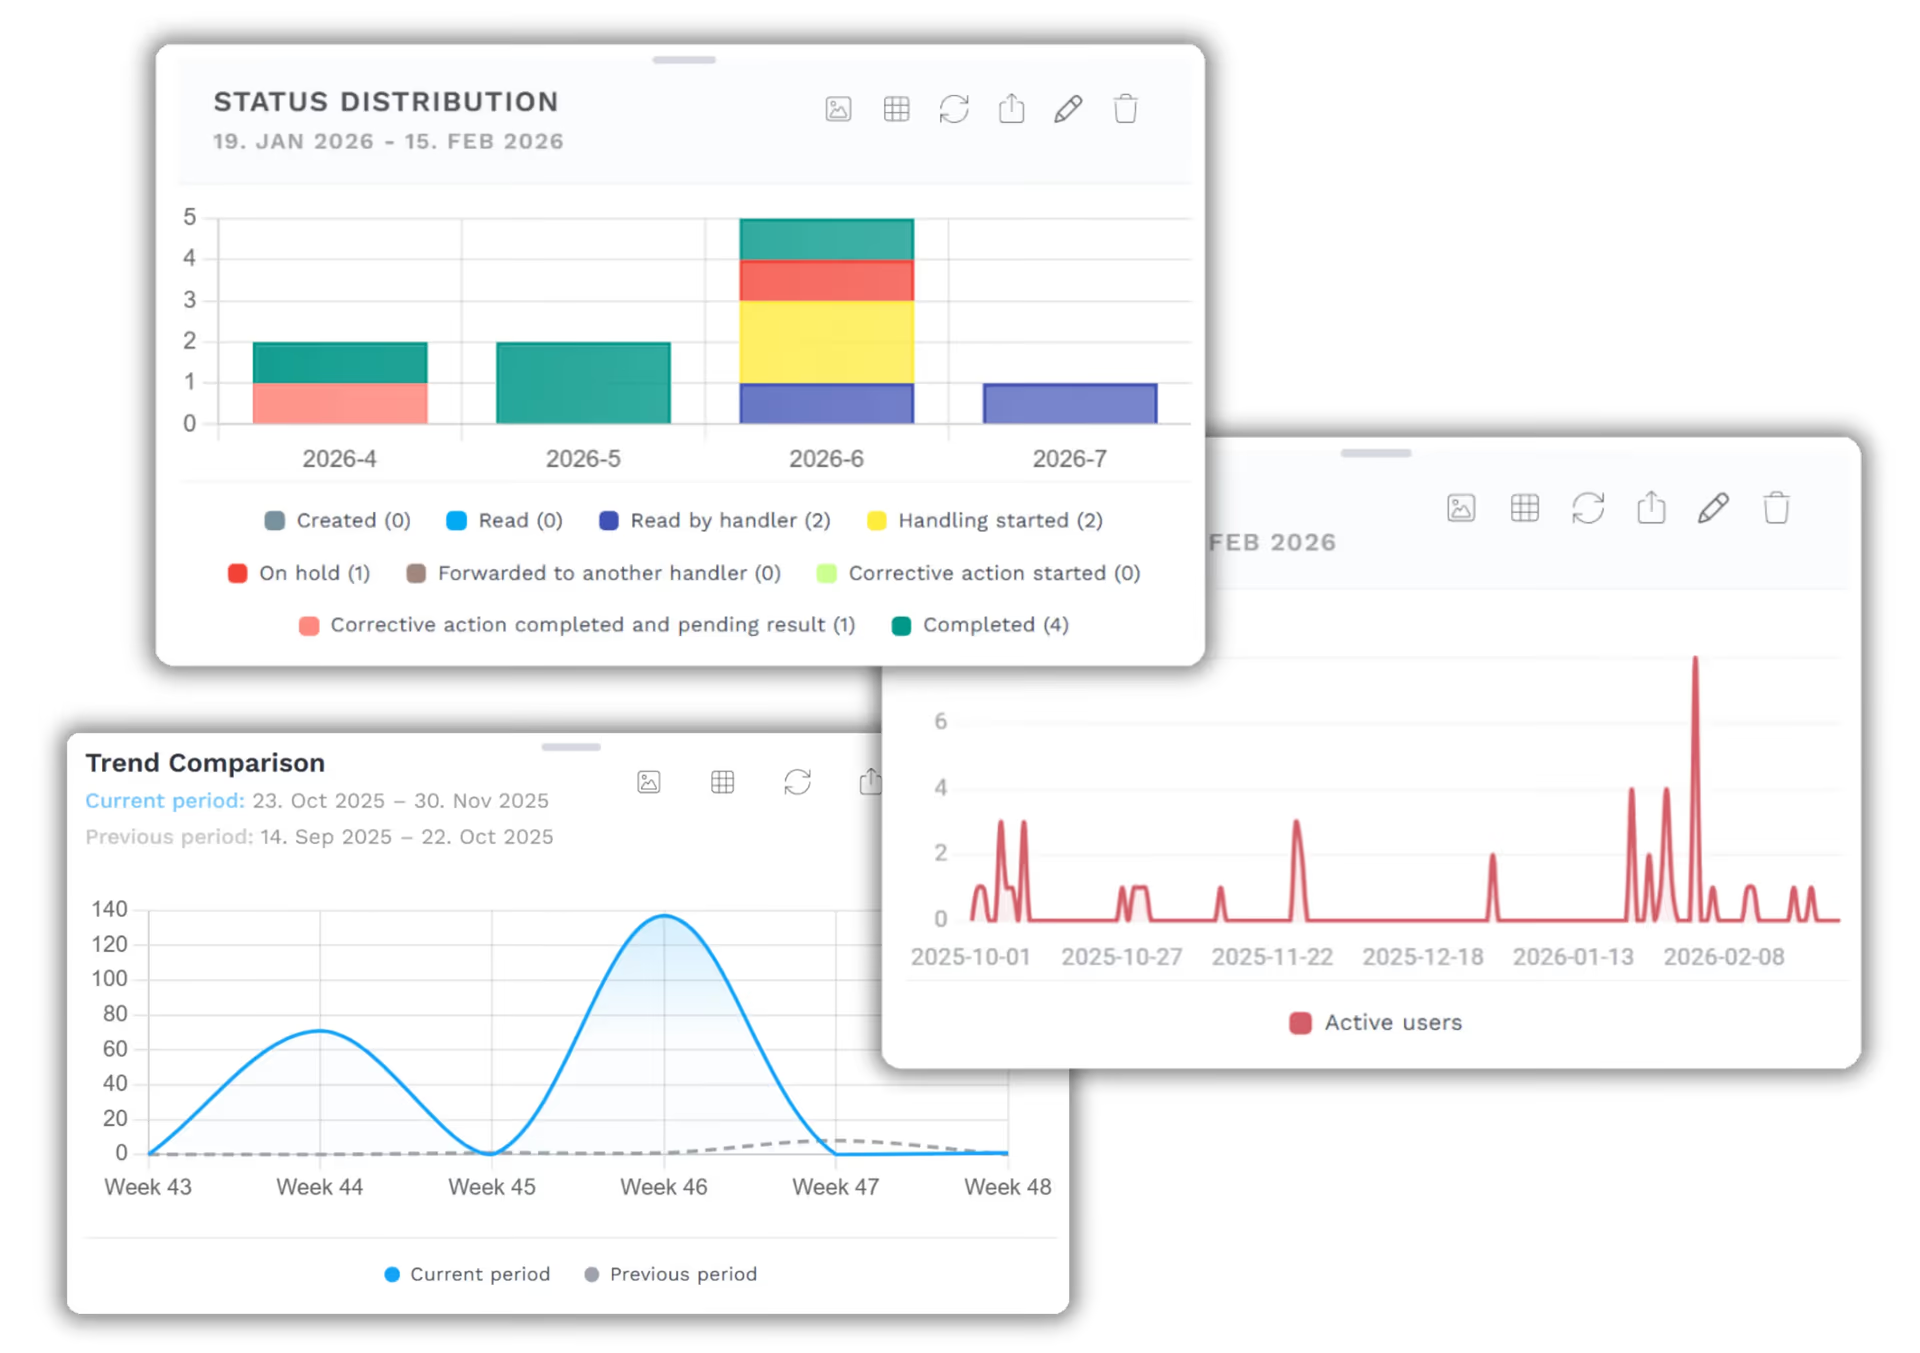
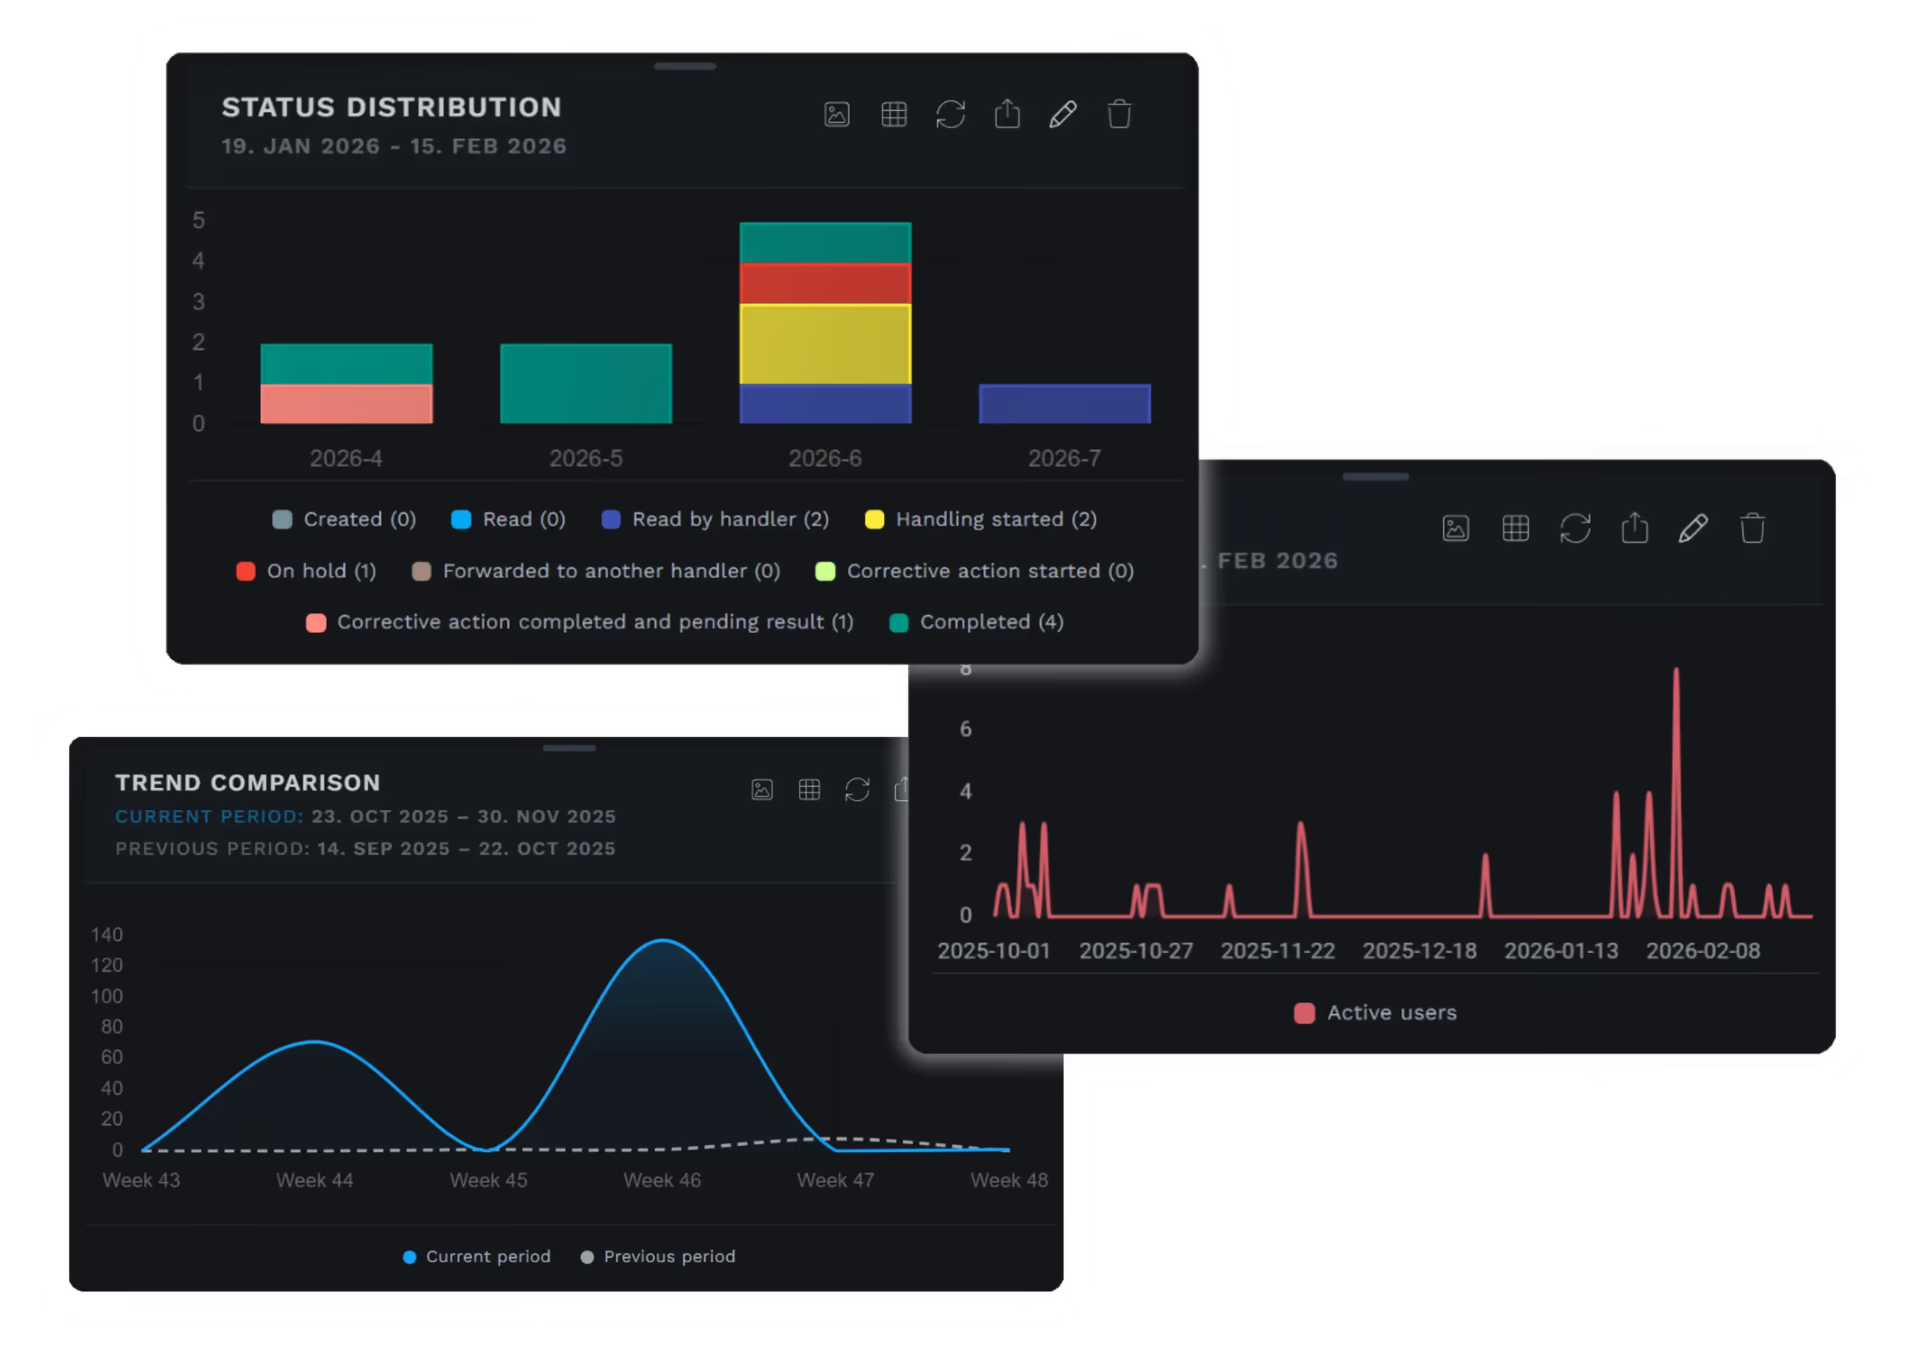
Unified Insights
Identify and analyse root causes and trends instantly.
Automatically isolate your top contributors to issues and highlight operational bottlenecks.
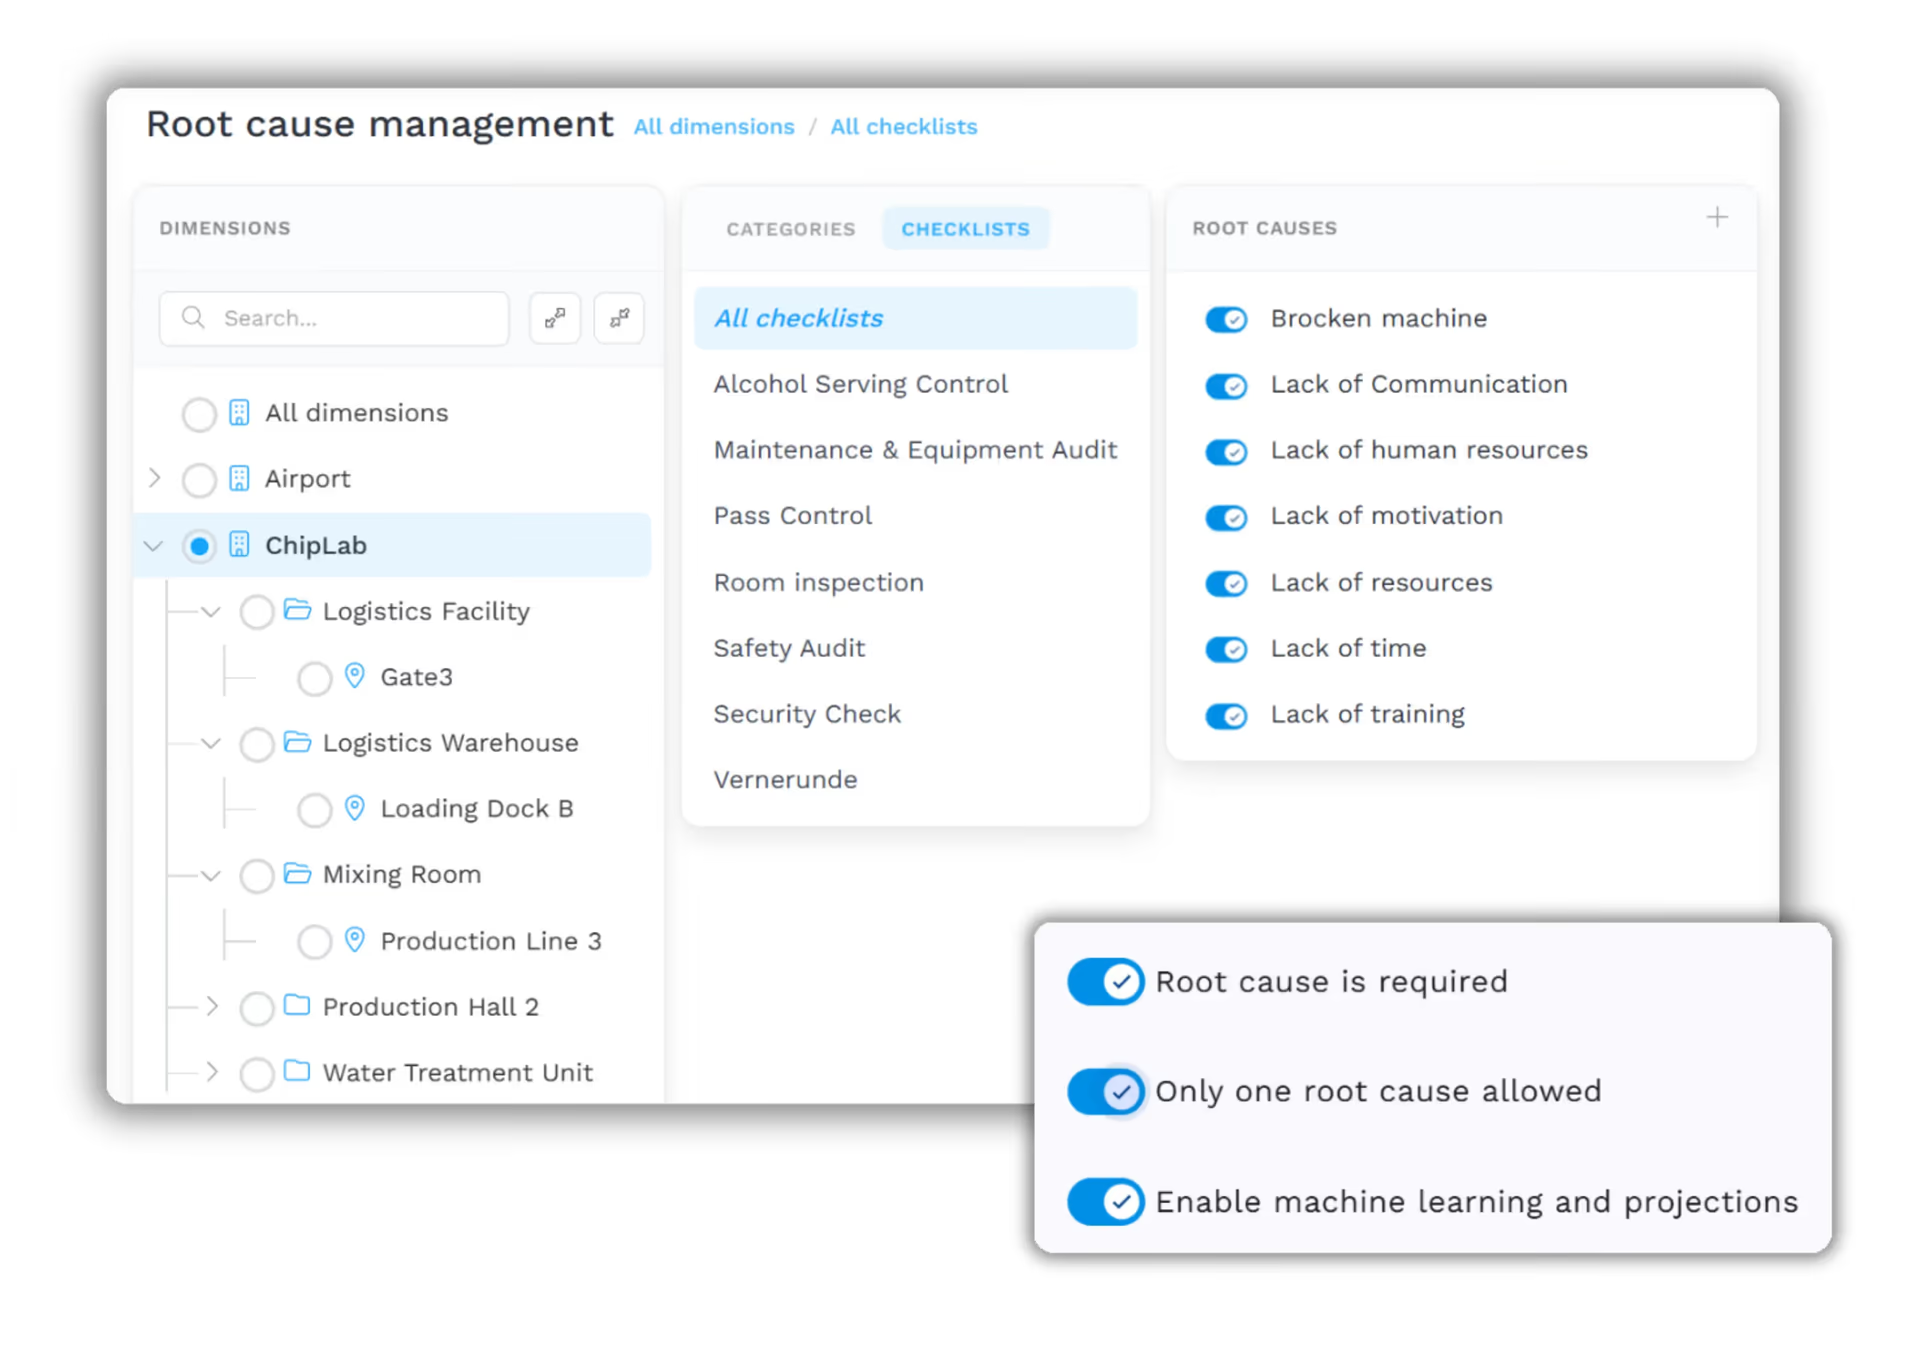
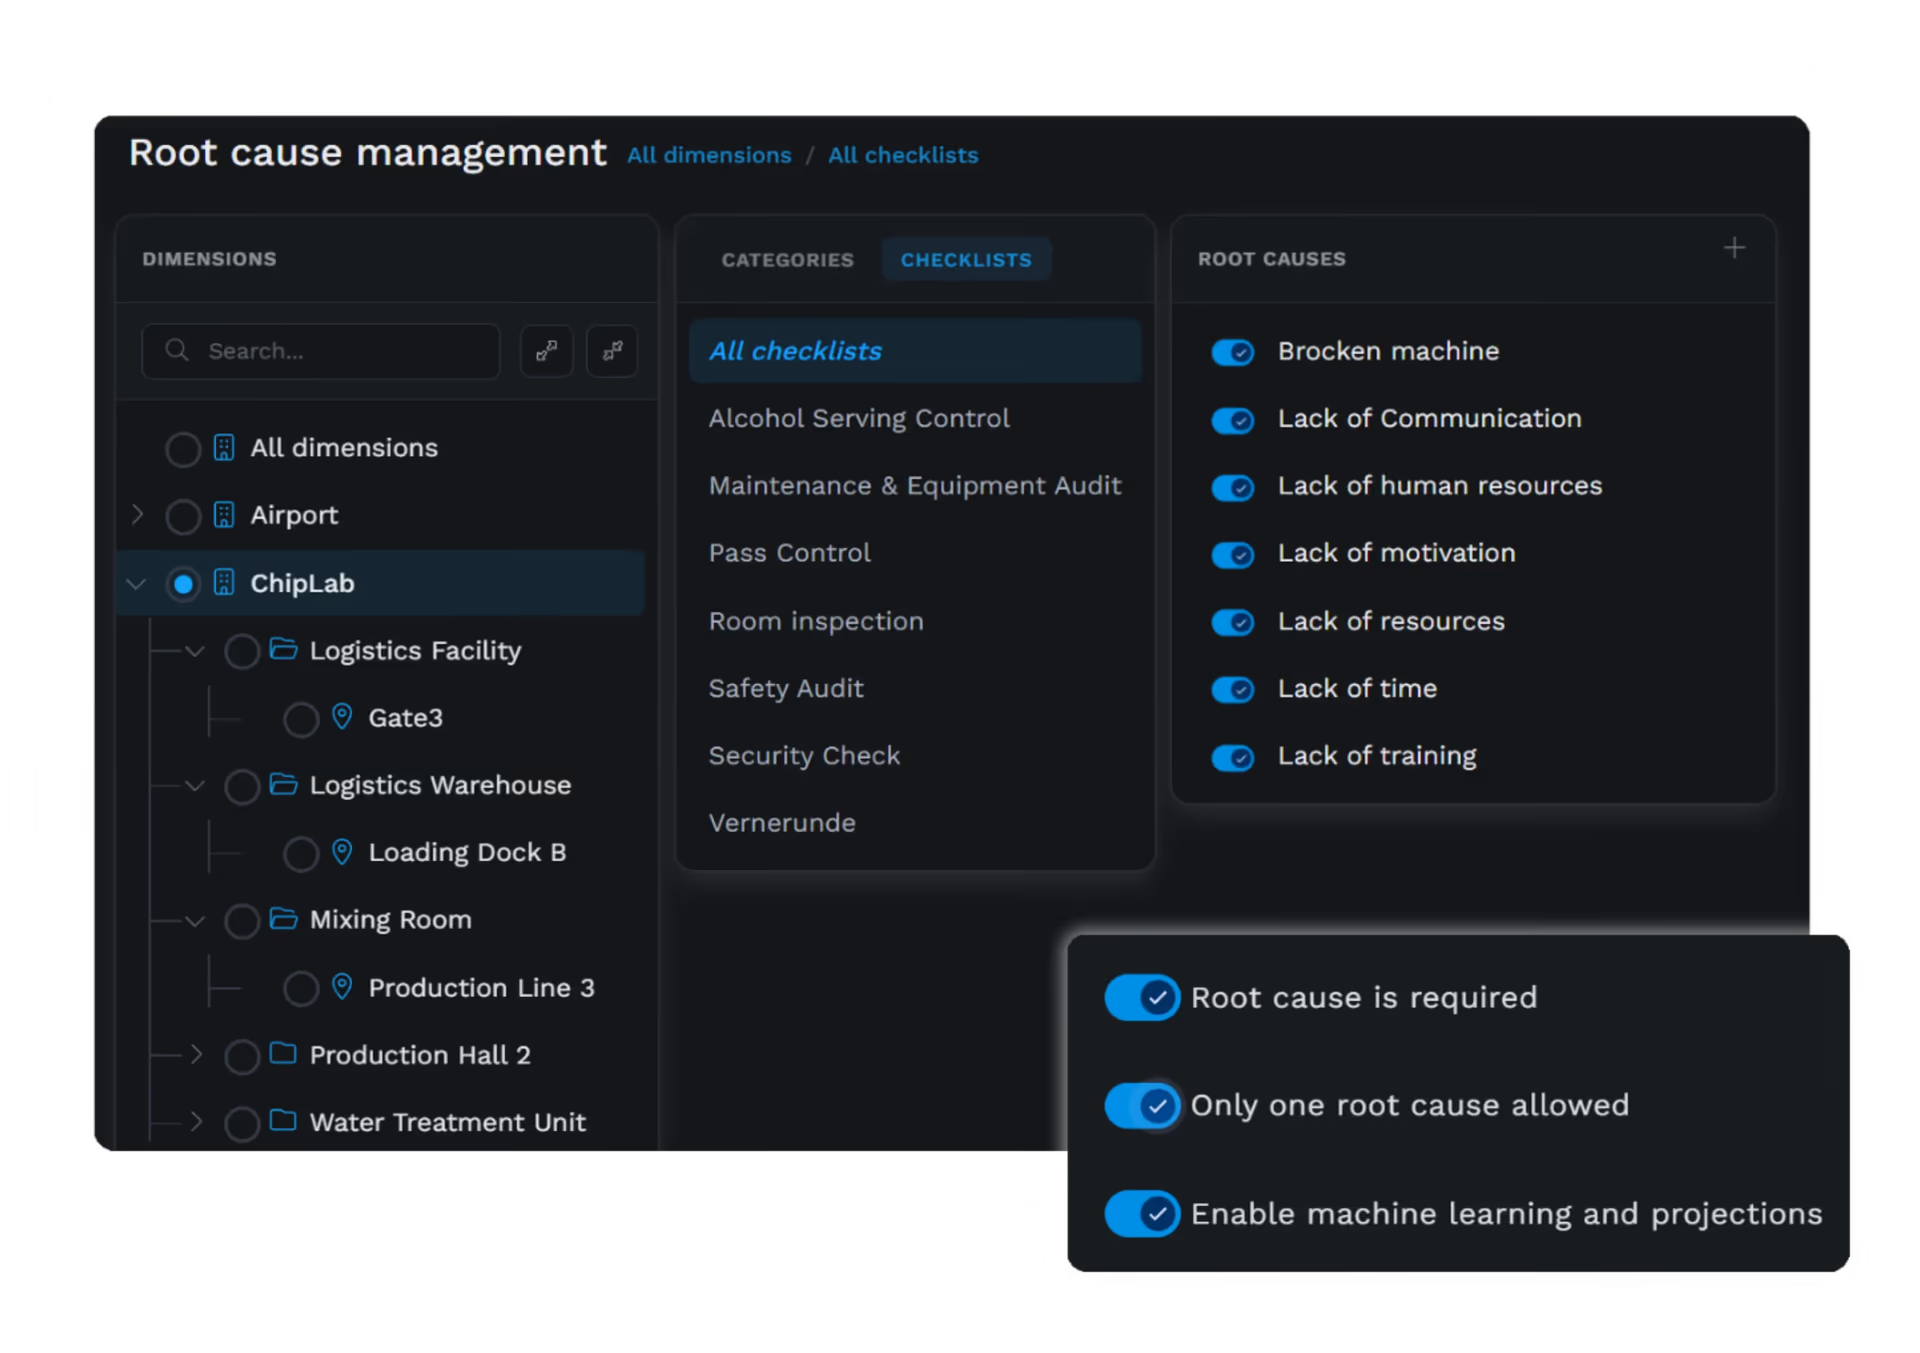
Operational Transparency
Gain a full view of performance across your entire organisation.
Filter by location, department, or category to uncover deep insights effortlessly.
Flexible Visualisation
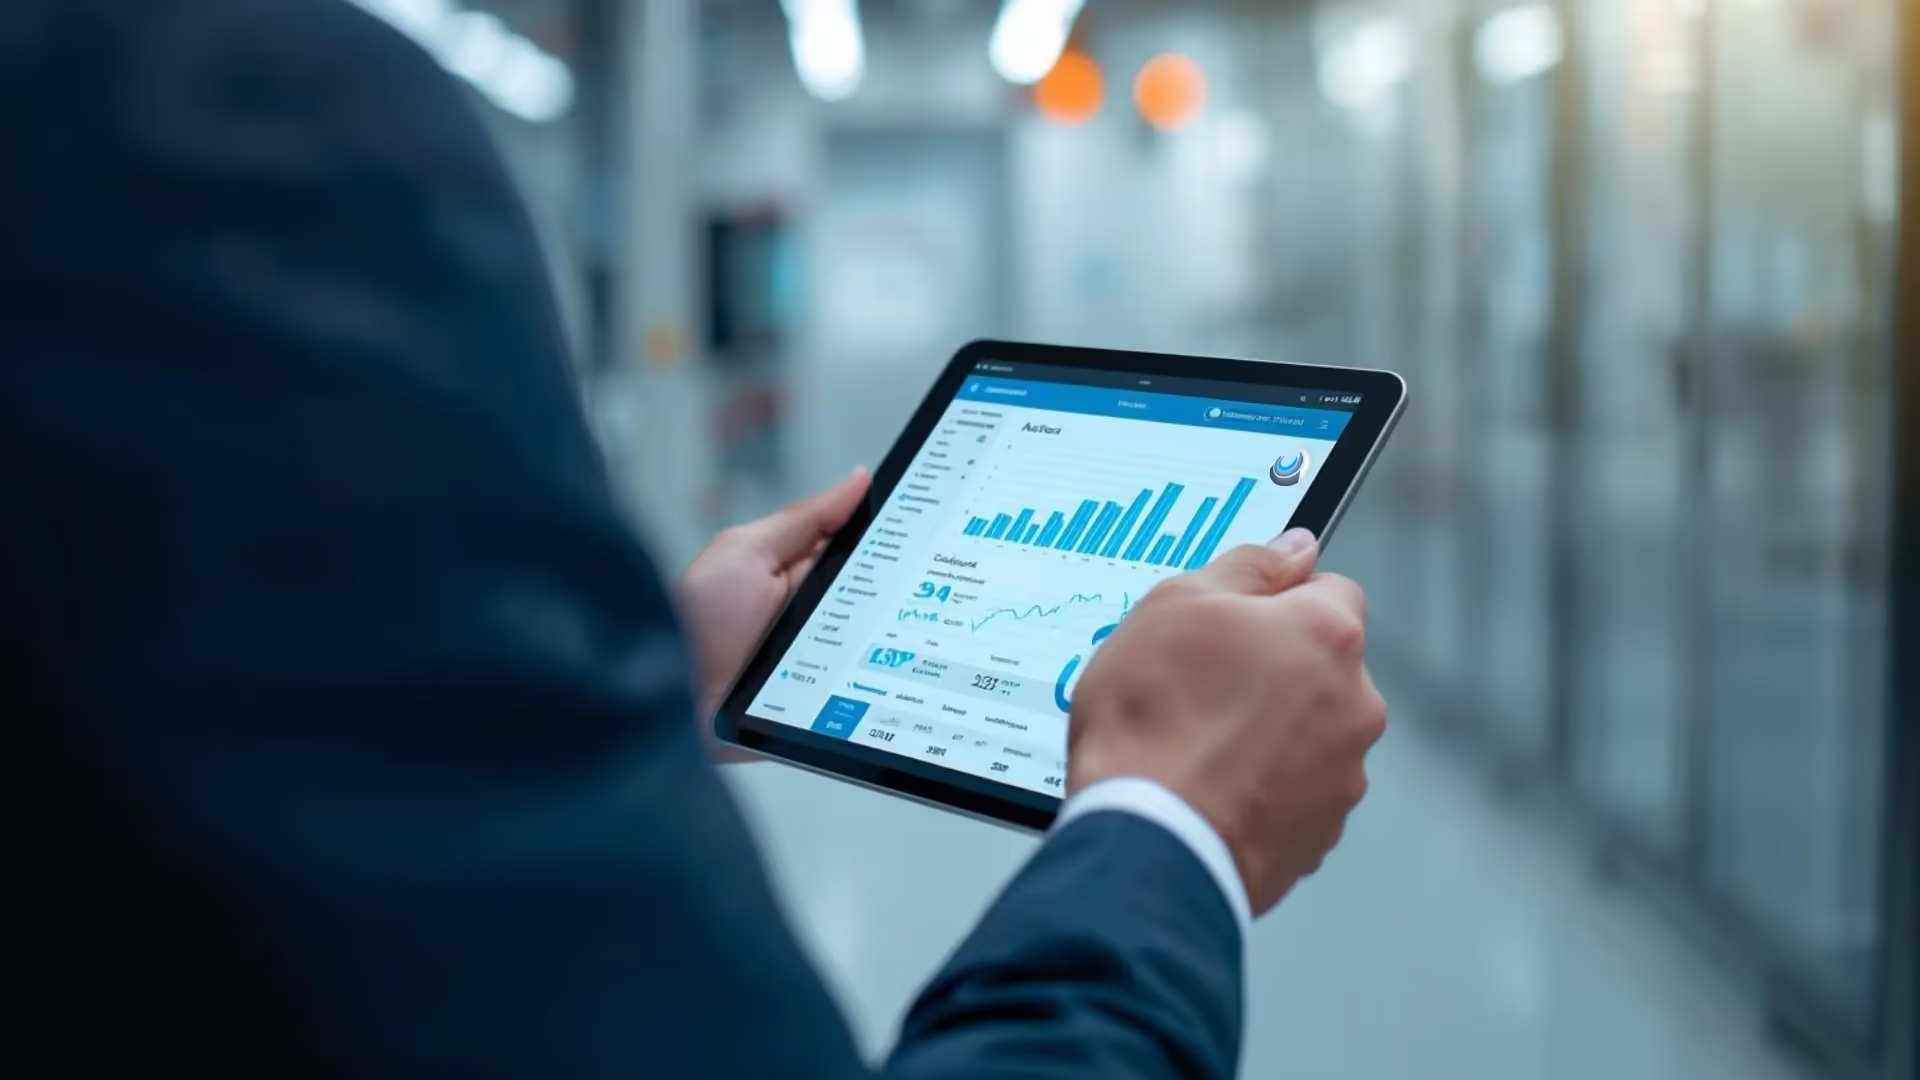
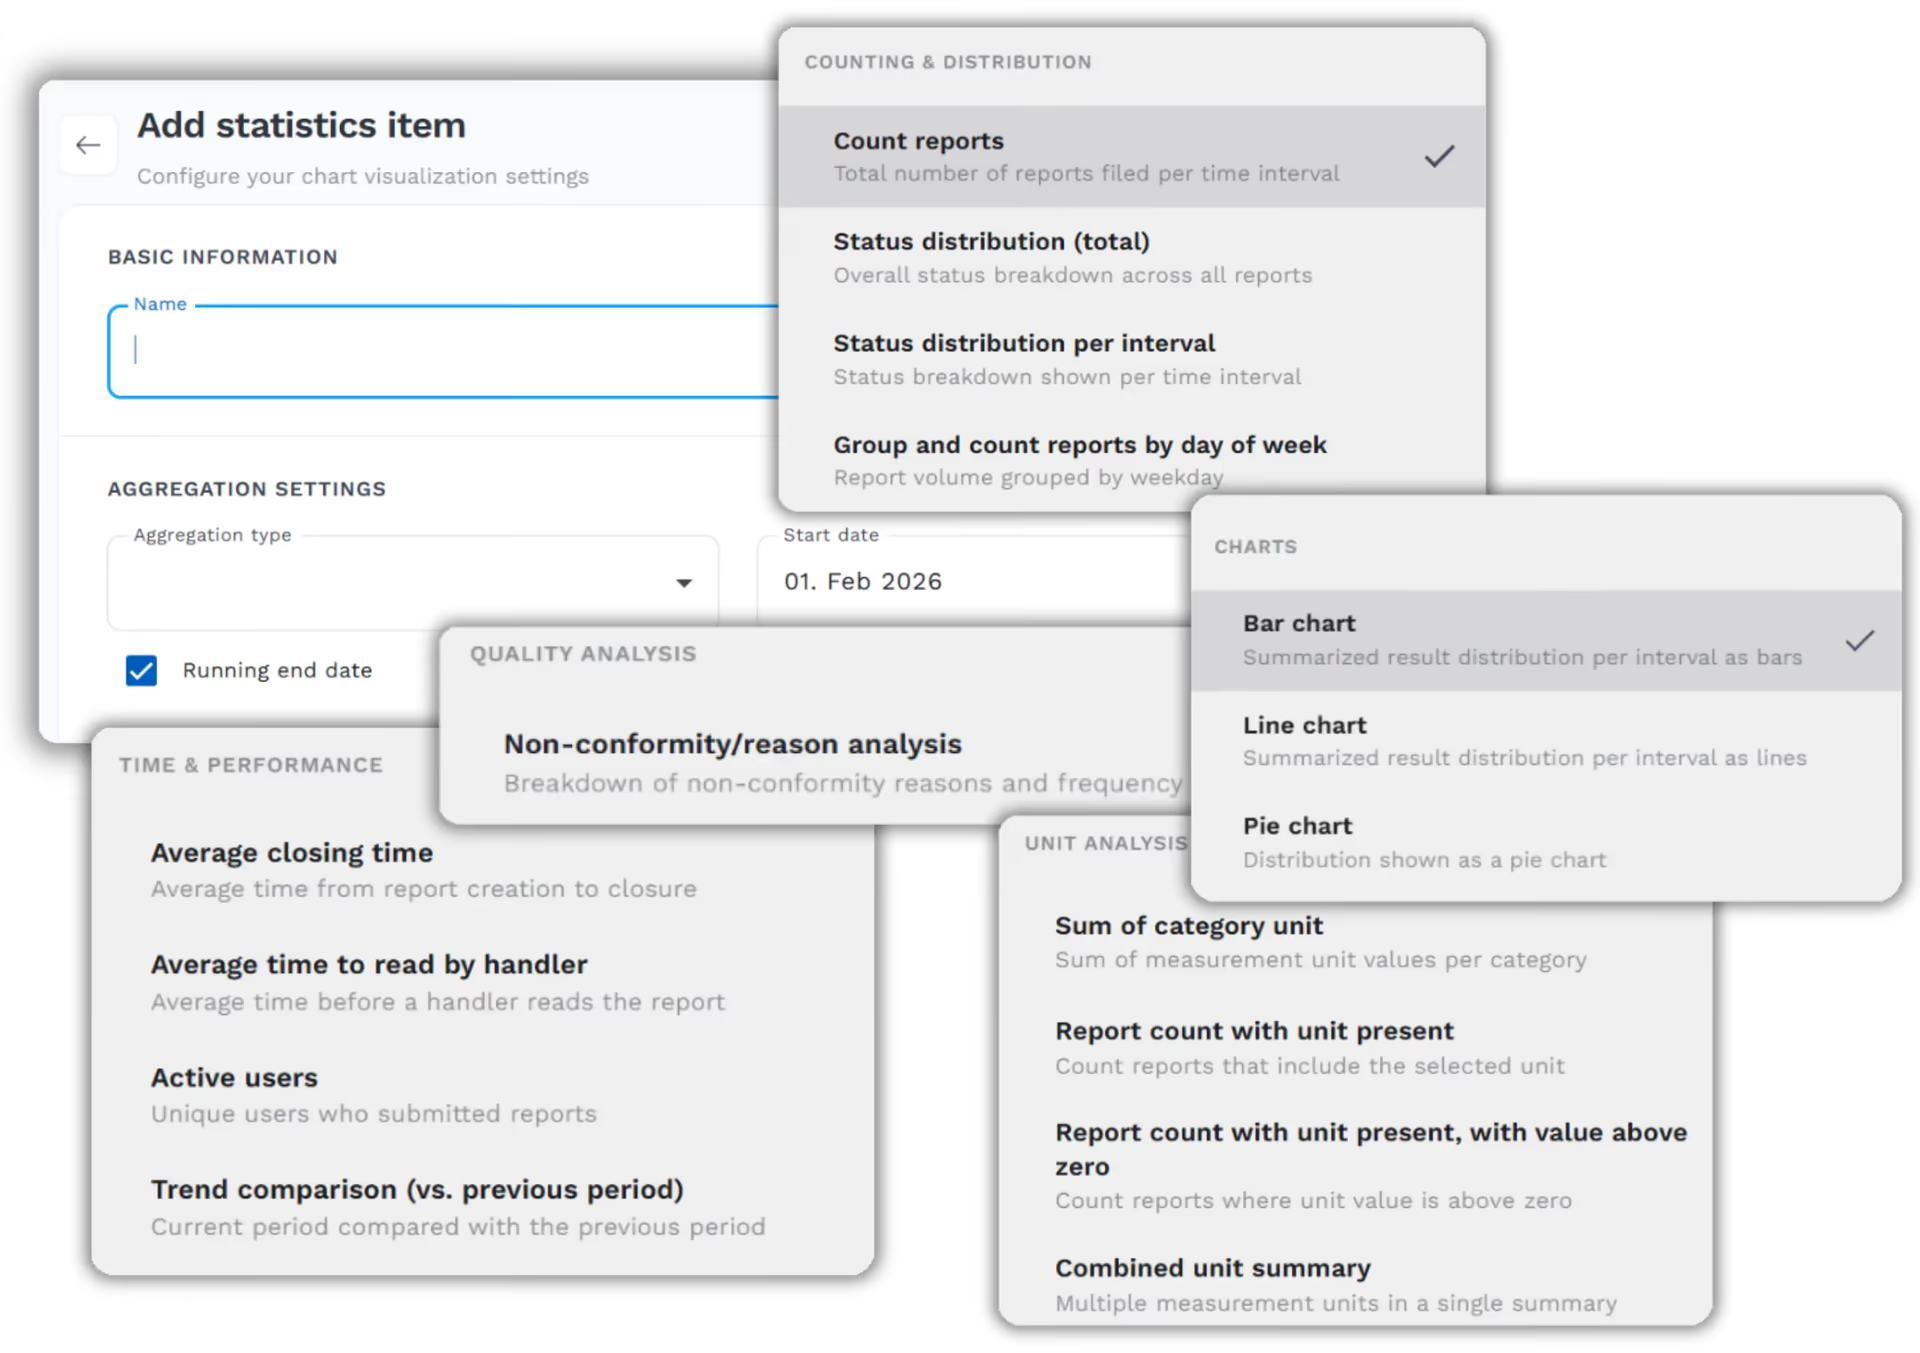
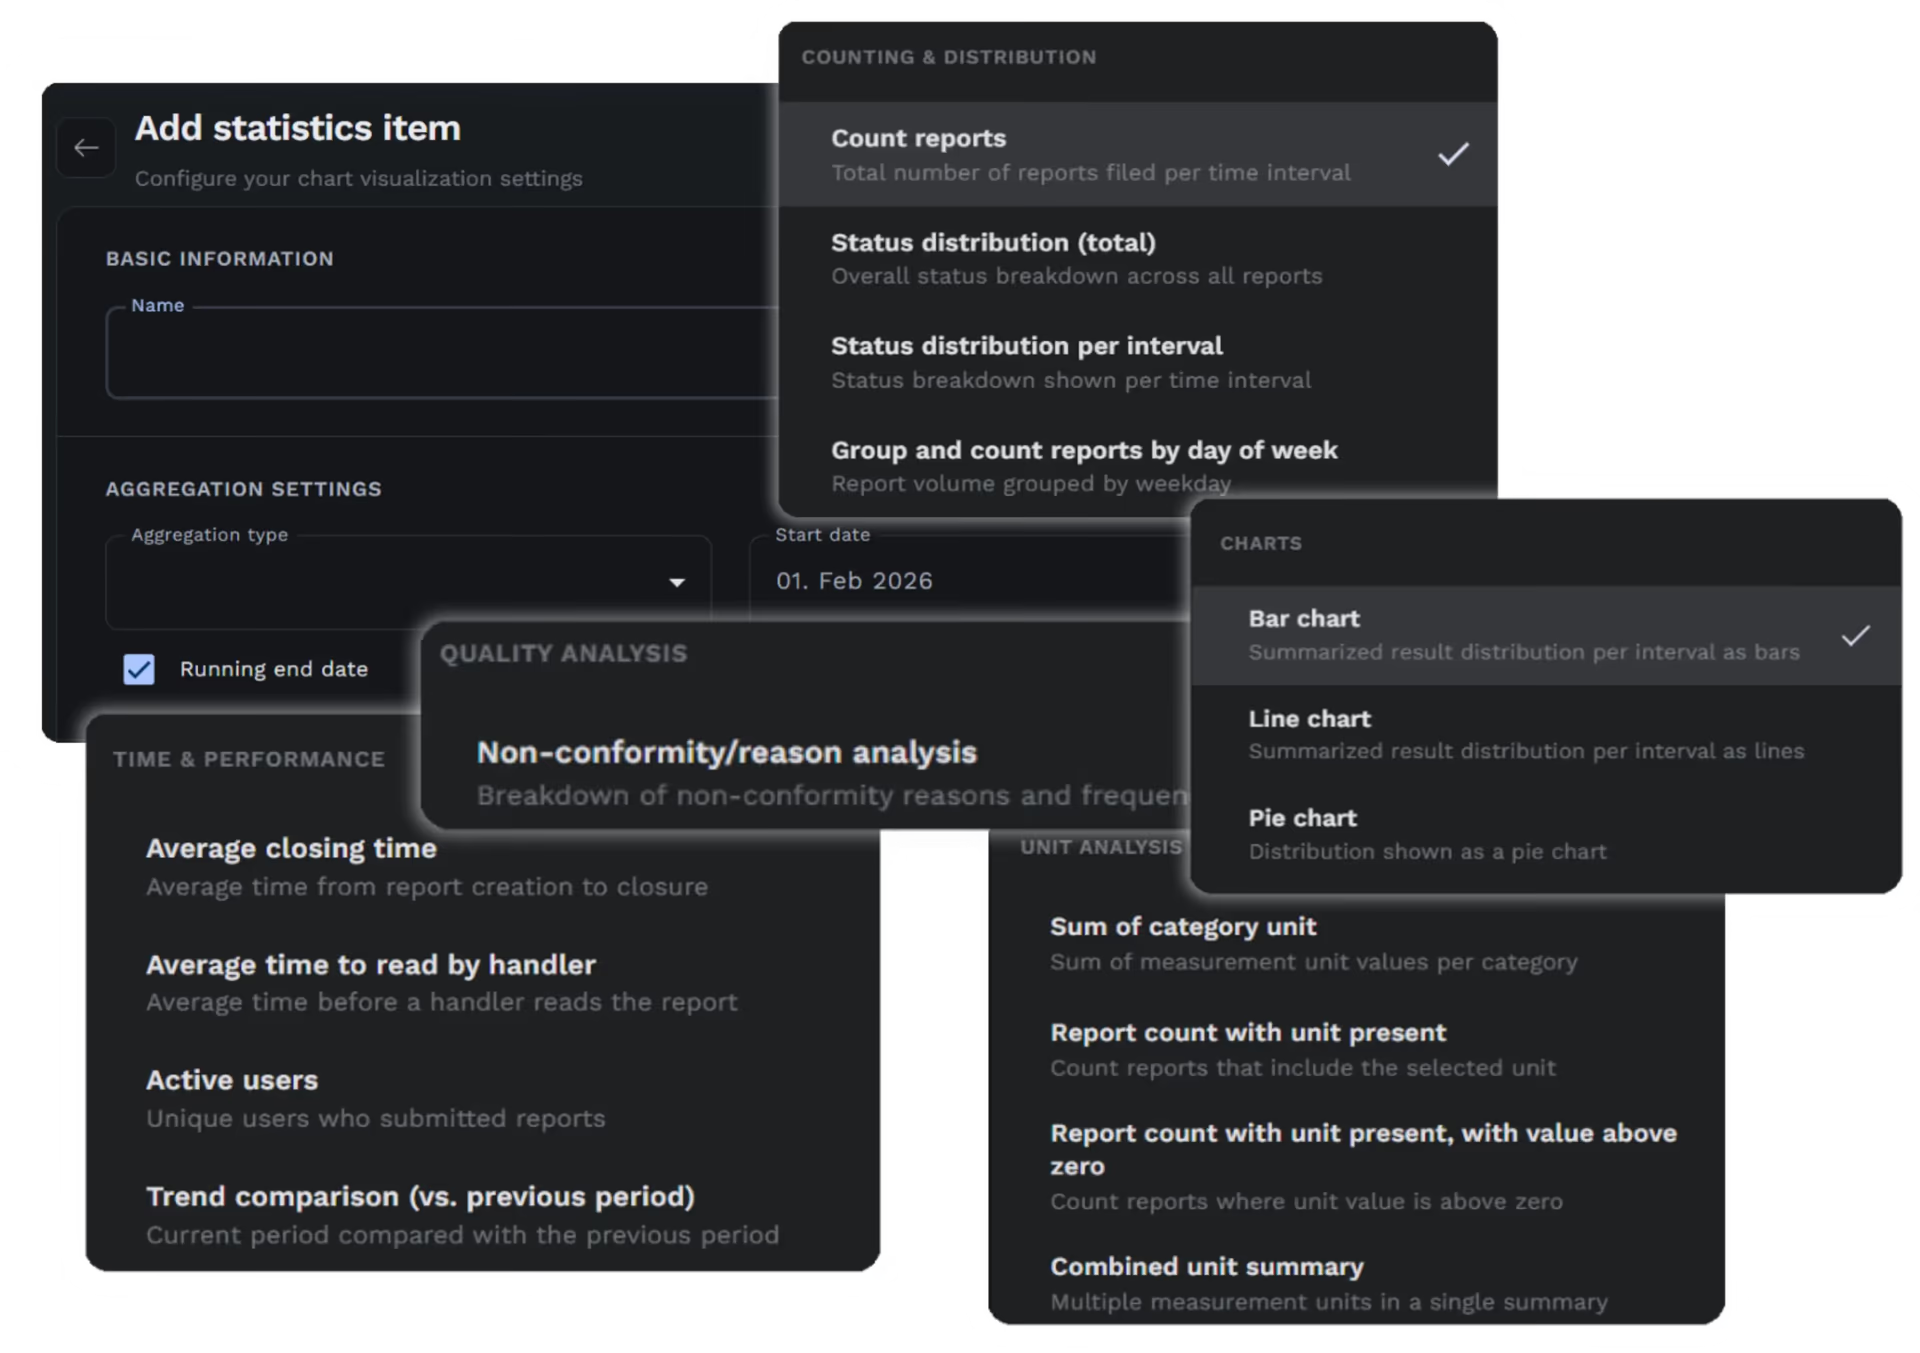
Visualise your KPIs clearly using a diverse library of chart types like Bar, Line, or Pie.
Customise your visuals to highlight critical metrics, making data easy for your team to read.
Secure Distribution
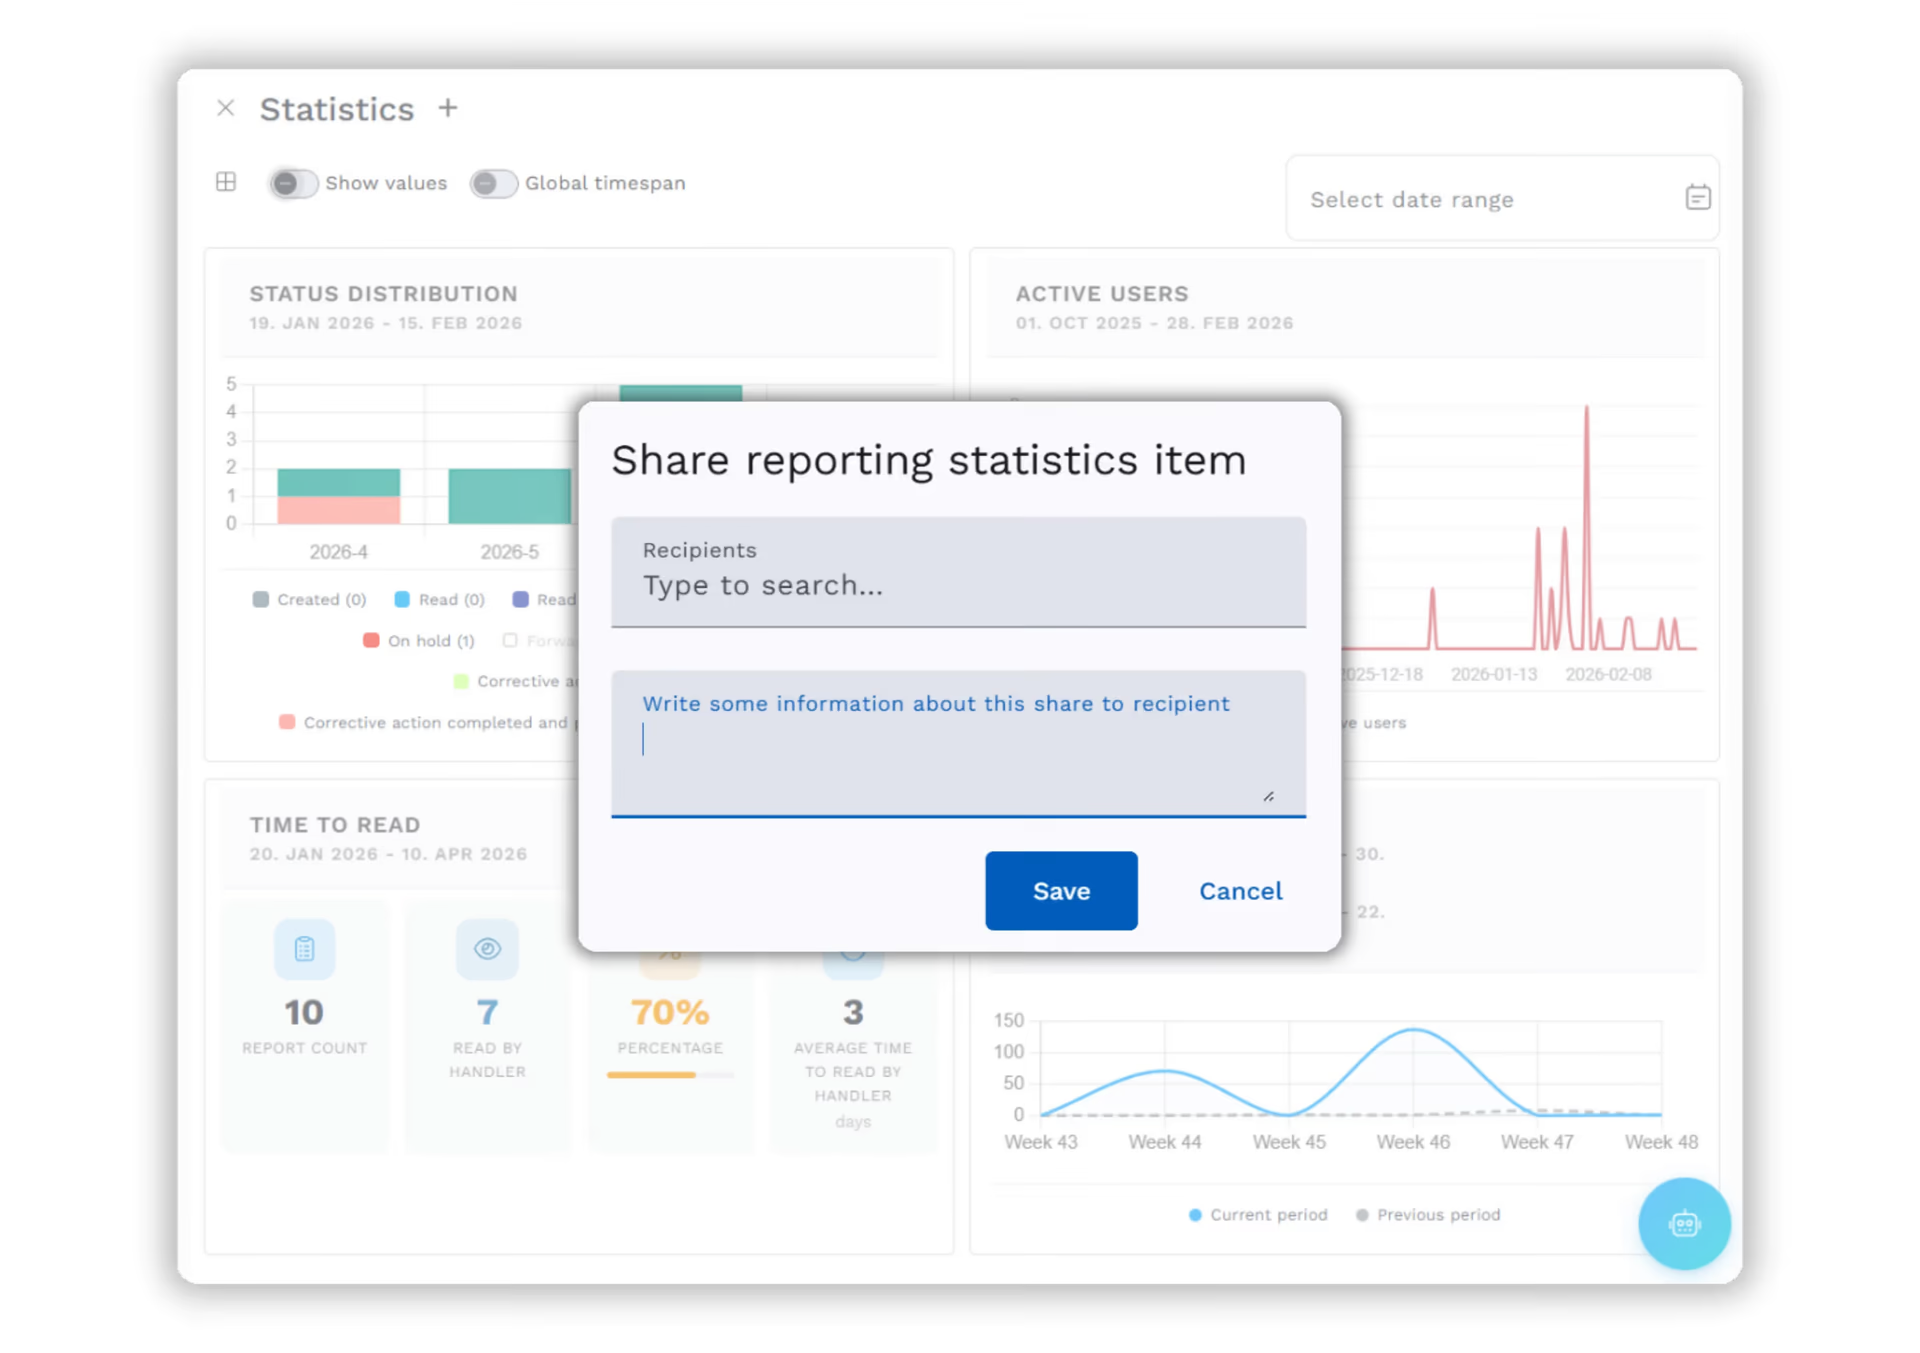
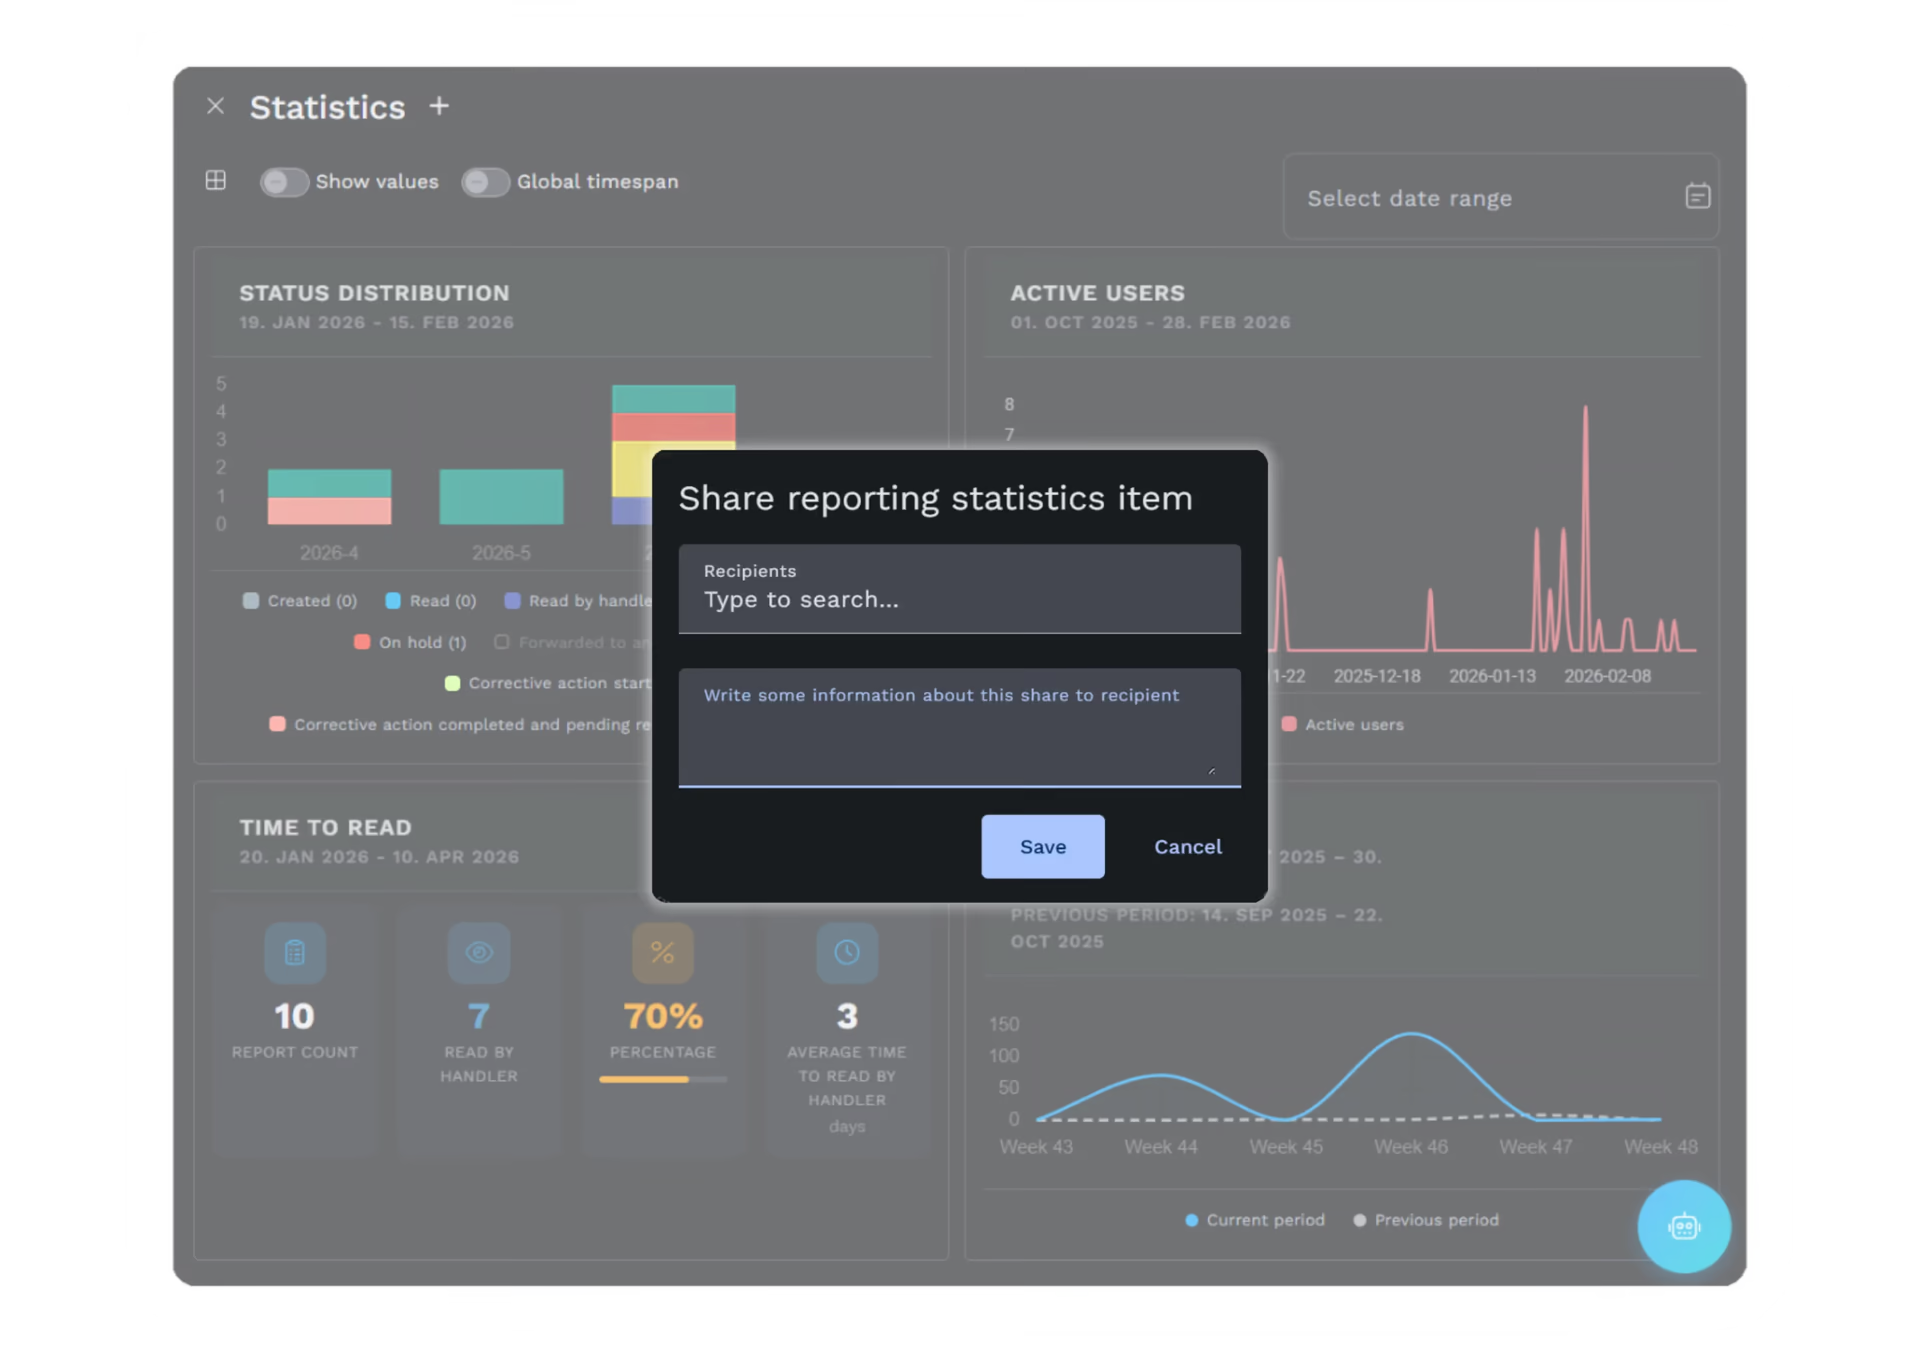
Control exactly how you share dashboards or specific charts.
Align your teams and facilitate collaboration while maintaining strict security protocols.
See everything at once.
We'll build a live dashboard from your own data.
How Unified Analytics Transforms Operational Data
The data questions your management team asks every day — answered instantly.
Your Statistics Workflow with Unified Analytics
From raw operational data to real-time decisions — without a single spreadsheet.
Data Collection
Your data is ready for analysis the moment a report is submitted or an inspection is recorded.
Dashboard Design
Use the drag-and-drop tool to arrange your board and display it on big screens for management without downloading a single file.
Deep Analysis
Select the charts and KPIs that matter to you. Use the filters to drill down and find the root causes behind the trends.
Secure Sharing
Send live insights securely and empower your team to act fast based on real-time data.
Decide with facts, not guesses.
Give your team a live view of operations. Free for 30 days.