What does early turnover actually cost?
Nordic frontline teams turn over fast, and hotels and restaurants fastest of all. Eurostat figures published in February 2026 put 49.6% of Norwegian accommodation and food-service staff at under a year in the job. Retail sits at 28.5%. Health and social work at 20.3%. Statistics Sweden puts 40.0% of Swedish hotel and restaurant jobs at under six months.
Every one of those departures was paid for in advance. The advert, the screening, the manager's hours, the trainer's hours, the kit, the certificate, and the weeks where the new person worked slower than the person they replaced. Someone who leaves in week three has used all of it and given almost none of it back.
This article is about cutting that loss. The way to do it is to make the first weeks work, and to measure the thing that tells you how you are doing. Guessing who will quit fails on the evidence and sits in difficult legal ground, so we will leave that aside.
Why is "cost per hire" the wrong headline?
Cost per hire is easy to work out and tells you very little. It stops counting on the day the person starts. The bigger costs come after that: the trainer's time, the slow weeks, the mistakes, the overtime covering the gap. Almost nobody counts them.
It also invites comparison, and there is nothing solid to compare against. Neither Statistics Norway nor Statistics Sweden publishes employer-level turnover, and no official Nordic cost-per-hire figure exists. The national numbers quoted in board papers measure job flows or employment spells, which is a different thing entirely.
You will also meet multipliers: replacing someone costs 33% of salary, or 50%, or twice annual pay. None of these come from proper cost accounting. The best frontline costing work available studied 33 US hotels. It found the cost swinging wildly depending on how complex the role was and how busy the hotel was — the opposite of a universal multiplier. Losing someone from a full hotel in July costs more than losing the same person in a quiet November. So work out breakeven per role, and per season if your business has seasons.
Use your own arithmetic. It takes an afternoon, and you can defend it in a way no borrowed number allows.
What goes into the number?
For one person leaving and one replacement arriving:
| Part | What it covers | Where the number comes from |
|---|---|---|
| Closing out | Exit admin, final pay and holiday settlement, collecting kit back, deregistration | Time log × loaded hourly rate |
| Covering the gap | Hours covered by overtime or agency before the replacement starts, at the premium | Rota × the premium in your agreement |
| Hiring | Advertising, agency fees, screening, the hiring manager's hours, paid certificates | Ledger, plus a time log over one hiring round |
| Supervision | The trainer's or buddy's hours while the new person gets up to speed | Rota |
| The ramp | What the new person failed to produce while learning the job | Measured — see below |
| Errors and rework | Waste, breakages, re-cleans, voids and corrections that come with the ramp | Your waste and quality records, split by how long people have been there |
Use the loaded hourly cost throughout. That is the wage plus what the employer really pays on top of it. In Norway that works out around 1.30 once employer's contribution, holiday pay and pension are in. In Sweden around 1.47 on statutory costs alone. One exception is worth catching: between April 2026 and September 2027 the employer contribution is reduced for 19 to 23 year-olds earning up to SEK 25,000 a month, which brings the factor nearer 1.35. With around 60% of hires in these sectors under 25, that is more than a footnote.
The ramp is the part people find hardest, and the part most worth measuring. Take what a new person produces on their first solo shift, as a share of what an experienced person produces. Then count how many shifts it takes them to reach that level. Count shifts worked rather than calendar weeks. In sectors that are 40 to 61 per cent part-time, calendar time gives a misleading picture of how much experience somebody actually has.
Two things to watch. People improve fastest at the start, so a straight-line estimate usually overstates the cost. And speed is a different thing from quality: a new starter who works fast and badly looks fully up to speed, which is exactly why errors and rework belong in the model.
One adjustment most models miss, and it matters most in these sectors: some replacements leave early too. If only seven in ten of your hires stay long enough to repay their setup, your hiring and ramp costs are about 43 per cent higher than you calculated. You are buying the same post more than once.
What is breakeven tenure, and why does it matter?
Add up everything you spend before the person is productive: hiring, the trainer's hours, the ramp itself, and the cost of closing out whoever they replaced. That is your up-front investment, and it is the same whether the person stays three weeks or three years.
Now ask how long they have to stay before what they produce has paid it back. That point is your breakeven tenure.
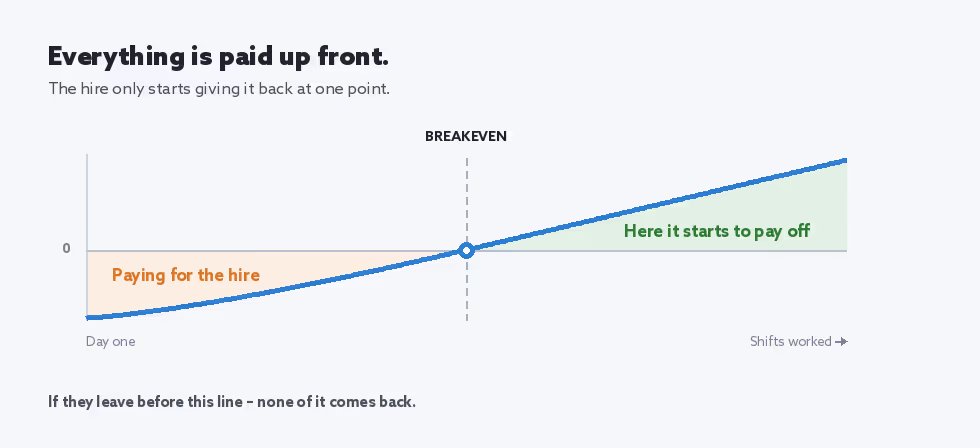
Two numbers come out of this, and both belong in front of a board:
- Breakeven tenure in weeks, per role and per site.
- The share of last year's leavers who left before it.
The second one is the headline. It turns "we have a turnover problem" into "this share of everyone we hired last year never repaid the cost of hiring them". That sentence survives scrutiny, because every figure in it came from your own payroll.
What keeps the number defensible?
- Say what you counted. Seasonal endings, on-call staff, agency workers, internal moves, people who chose to leave against people who were let go. Keep those last two apart throughout.
- Give a range rather than one figure. Run it twice, pessimistic and optimistic. A wide range tells you something useful about your record-keeping.
- Show headcount and full-time-equivalent versions wherever part-time staff are more than about a quarter of your people. That covers all of these sectors.
- Use a rolling twelve months and a cohort denominator for new-starter survival: of the people hired in a given month, how many were still there at 30, 90, 180 and 365 days.
- Keep national statistics out of it. They measure something else.
- Show the arithmetic to your union representatives. In Norway the design of this kind of measurement is a consultation matter, and a cost model the union has already seen survives contact with a negotiation.
For external reporting, the standard is ISO 30414:2025. A template citing the 2018 edition is out of date — that version was withdrawn in August 2025.
Why do people leave in the first weeks?
Early departures work differently from later ones, and that is what makes them fixable. Treat what follows as a well-grounded explanation rather than something proven in Nordic frontline work.
Shocks rather than slow disappointment
The leading account of why people quit separates two things. Some leave because dissatisfaction built up over time. Others leave because of a shock — one jarring event that puts them in a frame of mind they were nowhere near the day before.
A new starter has no stored-up dissatisfaction to draw on. What they have is exposure to shocks. A first shift where nobody expected them. A rota published too late to arrange childcare. Training that was promised and then skipped. A payslip nobody explained. Being put on the floor with no one to show them how.
Every one of those is an admin problem. That is the whole opportunity.
Why does attachment start at zero?
The other half of the picture is embeddedness: the links you have with colleagues, how well the job fits you, and what you would give up by leaving. On day one it sits near zero, and it grows with time. That is why the risk is highest early, and it tells you what to do. Build those links quickly and on purpose, rather than hoping they appear.
Research on settling people in finds three things that build attachment: bring people in as a group rather than one at a time, work to a published timetable so the new person knows what happens when, and treat the skills they arrive with as worth having. All three are cheap. All three fit a shift rota.
Who are your new starters, actually?
This is the part that makes the argument concrete in a Nordic setting. Of 56,076 people hired into Norwegian hospitality in the first quarter of 2026, 28,343 — just over half — had no job in Norway at all a year earlier. Nearly 59% of hires were under 25. Around 48% of people whose main job is in the sector are immigrants, and union membership sits near 9%.
So the people most exposed to an unclear rota, an unexplained deduction or a first shift with no named contact are also the people least likely to have a colleague or a representative to ask. This is the strongest argument available that early attrition here is an onboarding design problem rather than a fact of the labour market.
What is still unknown
Nobody publishes when frontline leavers actually leave. There is no Nordic dataset showing how departures spread across the first shift, the first week, the first month, the first ninety days. Anyone quoting a tidy "X% leave in the first 90 days" for this market is quoting a vendor.
What is published is the shape around it. 60% of people whose main job was in Norwegian hospitality in mid-2022 were still in the sector a year later, and 44% after two years. Note that this is staying in the sector, which will always look better than staying with one employer.
Your payroll can produce the missing curve in an afternoon. It is the single most useful number here, and hardly anyone has it.
How do you take the friction out of the first days?
What does friction-free actually mean?
Something more specific than "welcoming". It means the new person can do what they need to do without having to ask someone.
The test is whether a new starter can manage four things on their own, before their first shift: find out when and where to turn up, know who to ask for on arrival, finish any training they need before they can work, and get an answer to an ordinary question.
Most onboarding failures are one of those four being impossible.
Training that arrives on a phone
The capability that matters most here is a course link sent by SMS. An administrator enrols people on a course and sends it. Each person gets a message with a personal link. Opening it puts them straight into the course — articles, video, the quiz and the grade, and a certificate code at the end where the course needs one. No login, and no app to install. The link is personal, expires after a set time, and you can re-send it or switch it off.
For frontline onboarding this removes the biggest single piece of friction, which is credentials. Someone who exists as a user record with a mobile number, and has no password, no work email and no app, can finish their mandatory training on the bus.
Language is handled properly. The SMS goes out in one of six languages, and the course runs in whatever languages you have translated it into. The learner can switch language part-way through.
Be precise about what this is, because the obvious shorthand oversells it:
| Sometimes claimed | What is true |
|---|---|
| "Micro-courses are sent over SMS" | The SMS carries a link to the course. The course itself stays in the browser |
| "Drip a lesson a day" | One message per enrolment, sent when you enrol them. There is no sequence and no scheduler |
| "Workers reply to answer questions" | Replies go unread. The quiz is answered in the browser |
| "Courses assign themselves when someone is hired" | Every enrolment is a deliberate action — by an administrator, or by the learner |
| "Set a deadline and chase who is overdue" | Deadlines and automatic reminders are still to come. Chasing is manual today |
That still leaves a capability worth having. It means you plan around it: enrol people deliberately at the moment you hire them, and put the chasing in a person's calendar rather than assuming the system does it.
Answers without asking a person
The second friction remover is the knowledgebase assistant. A new starter asks an ordinary question in their own words and gets an answer built from your own published documents, with the sources attached. No hunting through a shared drive, and no need to know which document holds the answer.
Two things to plan around. It needs a logged-in account, so unlike the course link it is a week-one tool rather than a before-you-start one. And there is no ready-made starting set for new joiners, so the new person has to know what to ask. In practice your first-week checklist should name the questions, rather than only pointing at the library.
Designing the first two weeks
- Publish the timetable. What happens on day one, day two, in week one, and who owns each item. A fixed, known schedule is one of the few settling-in practices with real evidence behind it.
- Start people in groups where the rota allows. Two people starting the same week is a group, and groups build links.
- Name a person rather than a role. "Ask for Marta" beats "ask your supervisor".
- Publish the rota early. The first four weeks, before day one. A predictable schedule is the best-evidenced frontline lever there is.
- Do the mandatory training before the first shift, using the SMS link, and pay for the time.
- Make the first shift a shadowing shift if the operation can bear it.
- Have the manager make contact before day one. The evidence is silent either way, it costs almost nothing, and it removes the commonest shock.
What actually reduces early turnover?
Ranked by how strong the evidence is, which is different from how often these turn up on a checklist.
Structured onboarding — good evidence for the direction
Research supports the claim that structured onboarding helps new people settle and keeps more of them. Two cautions. The figures that circulate — "82% better retention", "70% faster productivity" — trace back to one consultancy study that has been recycled for over a decade, and they are not evidence. And this research is overwhelmingly about salaried office newcomers. Whether it transfers to shift work is an assumption rather than a finding.
Use it for direction: structure beats improvising. Keep it out of your business case as a percentage.
Schedule stability — the strongest evidence for frontline work
This is the finding most missing from standard onboarding advice, and it comes from outside the HR literature altogether.
Large studies of hourly retail and food-service workers link an unpredictable rota to psychological distress and poor sleep, and to real hardship — going hungry, and struggling to pay for housing, medical care and utilities. In one of them, an unstable and unpredictable schedule was linked to distress more strongly than low pay was. A third study, covering 121,408 service-sector workers, looked at the same instability against whether people stayed.
The practical version is concrete: publish rotas well ahead, hold to them, keep hours steady week to week, and be honest at hire about what the schedule will really look like.
Two Nordic notes. These are US data, and Nordic collective agreements already put tighter limits on on-call scheduling. The underlying exposure is here too, though. Norwegian hospitality is 61% part-time, and Fafo's 2024 study of movement in municipal health and care found part-timers changing employer at roughly twice the rate of full-timers.
Honest job previews — small, cheap, reliable
Telling candidates honestly what the job involves — the hours, the pace, the physical demand, how customers behave — reliably keeps more people. The effect is consistently small. Do it because it costs nothing, rather than because it will move your numbers on its own.
Sensible, and still untested
A buddy or mentor, contact before the first day, and the familiar day 1 / week 1 / day 30 / day 90 check-in pattern are all worth doing. None of them has evidence isolating its effect in frontline work. The specific intervals in particular are convention rather than a finding.
Treat them as ways of delivering the things that are evidenced — a published timetable, links built early — rather than as interventions in their own right. And let no vendor, this one included, tell you the cadence is best practice.
The honest gap
Searches for controlled onboarding studies with retention outcomes in this sector come back with almost nothing. The advice in this field is under-tested.
That is an opportunity as much as a caveat. An organisation with several similar sites can produce better evidence than currently exists: roll a change out at half your sites first, and compare 90-day survival. Hardly anyone does this. It is far from hard.
Can you spot who is about to leave?
This section will contradict something you have probably been told.
The belief to retire
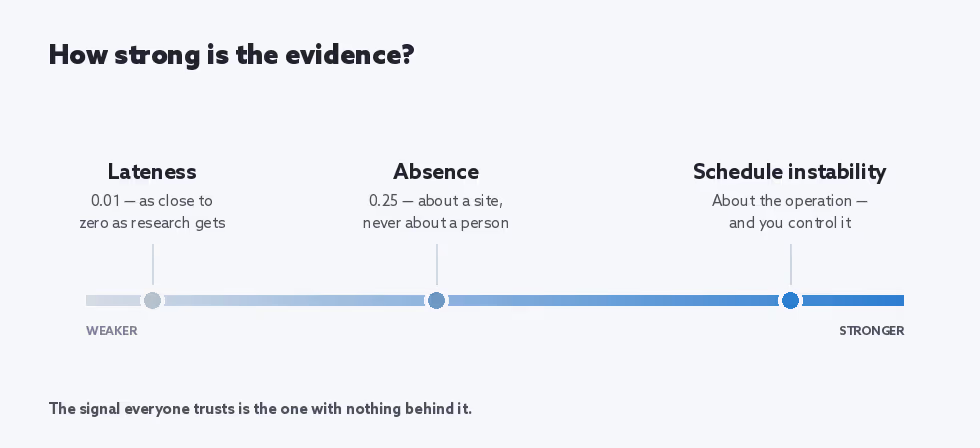
Lateness tells you nothing about who will resign. The meta-analysis of exactly this question puts the corrected correlation between lateness and leaving at 0.01, which is as close to zero as research gets.
The idea that someone drifting in late is on their way out is intuitive, widely believed, and contradicted by the best evidence there is. Any dashboard, product or consultant offering it as an early warning is selling folklore. The same study found that the wider idea of "withdrawal behaviours" forming one coherent pattern fails to hold together, and that these links have been getting weaker over time.
Absence — real, and still not about a person
Absence does relate to leaving: a corrected correlation of 0.25, which means the two share about six per cent of the picture.
That is a genuine signal across hundreds of people, and useful for understanding a site. It is nowhere near strong enough to say anything about one person. The gap between "visible in a population" and "actionable about a person" is the whole of the next section, and here it has a number attached.
Watch the work, rather than the worker
The signals with the best evidence are about the operation, and they have the useful property of being things you control:
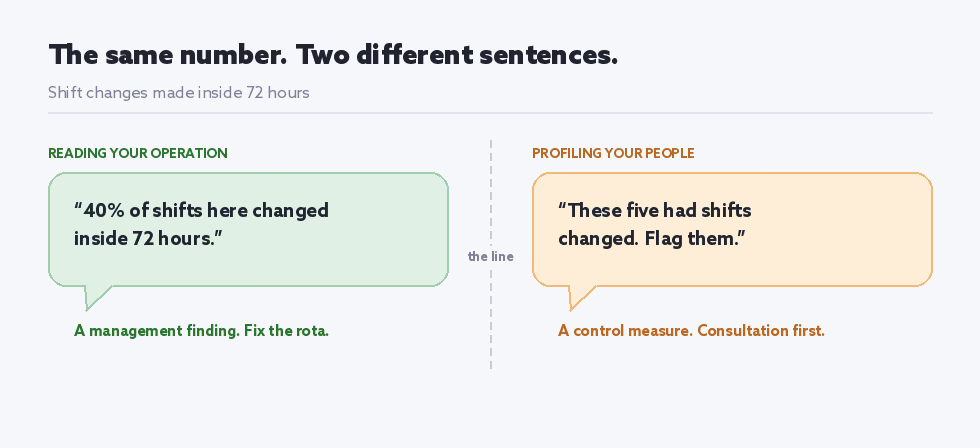
- Schedule instability — how many shifts you changed at short notice, how much warning people actually got, how much their hours moved week to week. Same underlying data as an individual monitoring programme, completely different object: "this site changed 40% of shifts inside 72 hours" is a management finding. "These five people had their shifts changed and are therefore flight risks" is profiling.
- Turnover spreading within a team — quitting clusters, and job-seeking appears to spread between colleagues. The mechanism has real research standing, though its size in Nordic frontline work is unknown.
- Job quality at team level — workload, autonomy, predictability.
Asking beats guessing
The things most reliably linked to people leaving are attitudes and attachment: how satisfied someone is, how committed, how settled. You measure those by asking. A short, voluntary question about whether somebody plans to stay, reported in aggregate, beats every behavioural proxy here.
It is also by a wide margin the cleanest option legally. Be honest about what it takes: a real survey instrument, run repeatedly, reported in aggregate, with individual answers never linked back to a person for management purposes. A five-question form and a spreadsheet will beat anything you could infer from attendance data.
What the platform genuinely raises today
Three attendance events reach a human without anybody going looking:
| Signal | Who is told | What it actually means |
|---|---|---|
| Missed clock-in | The employee first, then the shift planners and the reporting manager | Somebody has yet to clock in for a shift that has started. It fires on the first check after the start time, so a two-minute delay looks identical to an absence |
| Automatic clock-out | The planners | A shift was closed at its scheduled end because nobody clocked out. This has payroll consequences, so tell the person yourself |
| Declined shift change | The planners and the reporting manager | Somebody turned down a change to their published shift times |
Read the first one carefully. It is a prompt to check in rather than evidence of absence, and because the employee hears about it first, it works as a nudge rather than a report. Keep that framing when you introduce it. A system that tells you before it tells your manager is a very different thing.
The third is the most legitimate of the three to act on, because a declined change is a person telling you directly that the rota fails to work for them. Be honest about its predictive value, though: there is research in neither direction on whether shift-change behaviour relates to resigning. Act on it because somebody told you something, rather than because it forecasts anything.
The conversation to have anyway
A stay conversation in week two — what is working, what is awkward, does the rota work, was anything different from what you expected — brings out exactly the shocks described above, while they are still fixable. It needs no data processing at all.
Be straight about where it stands: this particular practice is untested. It is as good as anything else here, costs almost nothing, and is by a distance the cleanest option legally, because the person is telling you rather than you working it out about them.
Where is the line between reading your operation and profiling your staff?
Anyone building retention analytics in Norway or Sweden needs this before they need anything else here.
Group level or individual
Both Nordic data-protection authorities draw this line openly. The Swedish authority tells you to establish whether your purpose can be met at group level before going down to the individual. The Norwegian authority accepted one profiling arrangement in its regulatory sandbox specifically because individual results stayed out of the employer's reach, technically and legally.
One catch that bites in frontline settings: reporting "in aggregate" on a team of six identifies individuals with extra steps. Set a minimum group size and hold to it.
Purpose limitation — the one that catches people
"We already have the data, so we can use it" is wrong, and wrong in a way Norwegian case law has addressed directly. Data collected for rostering, payroll or time registration may not be reused for retention scoring. The purpose has to be set at the point you collect it.
This is the difference between a manager hearing a complaint about the schedule — information given to them for that purpose — and a model mining shift-swap logs. Same information, different thing in law.
Clearly outside the line
- Working out how employees feel. The EU AI Act's ban on inferring emotion in the workplace has applied since February 2025. That covers running sentiment analysis over free-text survey answers as a churn signal. The AI Act is yet to take effect in Norway pending EEA incorporation — check where that stands, and treat it as a near-term horizon.
- Quietly reusing operational data for retention scoring.
- Relying on employee consent as your legal basis. The dependency in an employment relationship makes it generally invalid, and all three relevant authorities say so.
- Covert scoring — a model your employees know nothing about.
- Rolling anything out without consultation. In Norway this is express: chapter 9 requires the employer to discuss control measures with elected representatives. In Sweden the duty to negotiate before a major change binds employers with a collective agreement.
- Feeding sickness-absence data into a model without a specific legal basis and an assessment.
- Predicting union activity, collective action or who will raise a grievance.
Clearly inside it, with conditions
- Group-level analytics by unit, with a minimum group size, nothing about individuals reaching any manager, the purpose stated from the outset, consultation done, and a data-protection impact assessment completed.
- A manager acting on something an employee actually told them. Ordinary management.
- Voluntary surveys reported in aggregate, where answers are never linked back.
- Structured exit interviews and analysis of people who have already left.
- Statutory absence follow-up — legitimate on its own footing, and kept to that purpose.
- Acting on group findings with group remedies: fix the rota pattern, the pay band, the span of control.
The argument that may persuade your board
There is a management case against monitoring that is stronger than the legal one.
A review of electronic monitoring across 59 separate samples found job satisfaction down, stress up, and performance essentially unchanged. The authors point out that this removes the usual justification for monitoring in the first place. Norway's strengthened duty on the working environment took effect in January 2026.
Put it together. A retention-surveillance programme delivers no average gain in performance, lowers satisfaction, raises stress, and is itself a risk to wellbeing that you have a statutory duty to manage. It may well increase the very attrition it was built to reduce.
A note on span of control
Unit managers in Swedish elderly care oversee 52 employees on average. A manager with 52 reports across a rota is exactly the person an algorithmic at-risk list most tempts — and exactly the person least able to apply the genuine, independent judgement that would keep such a list lawful.
The span-of-control problem and the profiling problem are the same problem. The group-level remedy — fix the span — is both more lawful and better evidenced than the individual one.
How do you make the case internally?
Careful here. This is where business cases overreach and get taken apart.
The best synthesis finds turnover's link with customer satisfaction and service quality is roughly twice as strong as its link with financial results. If you are arguing this internally, argue it on service quality. That is where the evidence is strongest, and where your frontline managers already agree with you.
Two honesty requirements. The research genuinely disagrees on size: one major meta-analysis puts the overall turnover–performance correlation near −0.15, another near −0.03. And the relationship is markedly weaker in Europe than in North America. Keep Anglo-American turnover rhetoric out of a Nordic board paper; somebody will check.
That disagreement is the best possible argument for working out your own number. Your breakeven tenure and your own survival curve are something nobody can dispute.
The one-page case
- Our breakeven tenure for this role is N weeks.
- Of the people we hired last year, X% left before it. They returned nothing.
- That cost us [the arithmetic], with the range stated.
- Early departures come mostly from causes we control — rota clarity, how we settle people in, training actually happening, the first shift.
- Here is the one change we propose, and here is how we will know whether it worked: staggered across sites, measured on 90-day survival.
Note what is missing from that list: any named individual, any borrowed benchmark, and any percentage from a vendor's brochure.
A ninety-day plan
For an organisation starting from scratch.
| When | What to do |
|---|---|
| Weeks 1–2 | Get the number. Pull the survival curve from payroll by how long people stayed. Work out breakeven tenure for your two or three highest-volume roles. Buy nothing yet |
| Weeks 3–4 | Find the shocks. Talk to twenty people who left within their first three months, and to the managers who hired them. Look for events rather than opinions: what happened, on what day |
| Weeks 5–6 | Fix the rota. Publish further ahead. Stop late changes. Measure how much warning people actually get, site by site, and treat that as a management metric rather than an HR one |
| Weeks 7–8 | Build the first-two-weeks timetable. Published, fixed, named person, groups where possible. Move mandatory training before the first shift |
| Weeks 9–12 | Measure, and stagger it. Introduce the week-two stay conversation at half your sites. Measure 90-day survival in both groups with operational analytics. You will learn more in one quarter than the published research currently contains |
Throughout: consult before you measure anything about people, keep reporting at group level, and write down your purpose before you collect.
Honest boundaries
- There is no reliable individual early warning for resignation. The best behavioural signals are weak (absence) or absent (lateness).
- The onboarding research is thin for shift work. Most of it studies salaried office newcomers. The directions transfer. The sizes should stay unquoted.
- No official benchmark exists for cost per hire, time to productivity, or employer turnover in Nordic frontline sectors. Every number in your case has to be your own.
- Sector retention and employer retention are different things. The published Nordic figures measure the first one.
- The three attendance signals the platform raises are operational rather than behavioural. They tell you a shift is going off plan. They tell you nothing about what a person intends.
- Course links by SMS remove the account barrier rather than the chasing. Reminders, sequences and deadlines are still to come.
- Monitoring individuals is a control measure (kontrolltiltak) with consultation duties attached, and the evidence says it fails to improve performance anyway.
Two things will stay constant, and they are the reason to trust the rest. Nothing here will offer an individual flight-risk score — the evidence explains why it would fail, and the law why it would be unlawful. And any measurement capability we add will report at group level, because that is the only footing on which this can be sold in the Nordics at all.

Bjørn Nese — Founder & Chief Engineer
Building operations software for high-compliance industries since 2011. Designs the platform architecture and the private in-house AI that runs it.
More articles by Bjørn Nese